The Many Ways to Highlight in Tableau
- Mar 2, 2023
- 3 min read
Did you know there are multiple ways to highlight metrics in Tableau?
If you are a beginner user in Tableau, you may not be aware of the highlighting functionality in the Legend. If a Legend for a chart is on your dashboard, you can click one of the metrics and it will highlight the metric in the dashboard. All of the other items in that graph will "grey out" as shown below;
Customers by Sales and Profit Scatterplot Example

Show Highlighter
If you didn't want to display a Legend for highlighting, you can right-click on a metric and select Show Highlighter to use Tableau's highlighting menu.

This will open a Highlight menu on a worksheet that you can add to your dashboard for the field you selected. They can type in the Region name (such as Central) in the example below or select one from the drop-down.
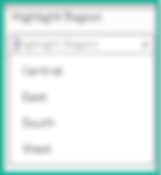
Tableau will then highlight the field similar to the Legend print screen above.
You can also highlight just one row in a crosstab view. I have a simple text chart with Subcategory and Sales in the print screen below. If you place the Sub-category field onto the Detail marks card and select Show Highlighter, Tableau will highlight any of the Sub-Category fields you selected in the Highlighter menu.

Using this same example, if you also placed Category on the Detail Marks card, and selected Show Highlighter, Tableau would highlight the fields for the Category you select.

Label Only on Highlight
In the previous tech tip below I show you how to highlight a point in multiple scatter plots at once.
Tech Tip > LINK

Highlight an Entire Field Using Reference Lines
In a previous tech tip below I show you how to automatically highlight a KPI field for a target. For the use case, I have a KPI field automatically change color to a light green if the month over month % difference in Sales for Segment is greater than 75%. I am able to do this with the use of Reference Lines.
Tech Tip > LINK

Highlighting Actions
In this Tableau Public dashboard LINK by Pravneet Singh, you can see that there are highlight actions enabled in a workbook. If you hover over a State in the Map you can then see the State highlighted in all of the other worksheets on the dashboard.

He reviews how to create this dashboard action in this PluralSight article here.
How to Highlight an Entire Row in a View
In this Tableau how to article, you can learn how to highlight rows with the use of a Parameter.
You create the below Parameter;

Then you create a Calculated Field to use this Parameter.

And then you place this Calculated Field on the Rows shelf, before your other items in a crosstab view. You then right-click to format and apply Column Banding on this column. (Format menu > Format Shading > Row Banding)

Then you hide the Header.
The only downside to this method is that the highlighted Segment will always display at the bottom.

Highlight Menu Using a Sheet in a Collapsible Container
In my Tableau public dashboard here I have a selectable sheet inside a Collapsible Container. You can select the items inside this container and it will change the color of these metrics in the dashboard. This is done with a series of Dashboard Actions and Parameters.

I learned how to create this from Erik Rettman! He has a Tableau Public dashboard which takes this idea further with a selection limit here.