Create a Drill-Down Proportional Bar Chart with Set Actions
- Jul 28, 2021
- 2 min read
Do you want to add a chart to your dashboard where you can click on it and drill into the next level of data? An example would be with using the Sales - Superstore Data set. You would click on the down arrow from the Category column to see a view with the Sub-category sales. You can also make the size of the Bars to be proportional to the amount of sales for that Sub-Category.
This example was modified from this youtube video by Andy Kriebel.
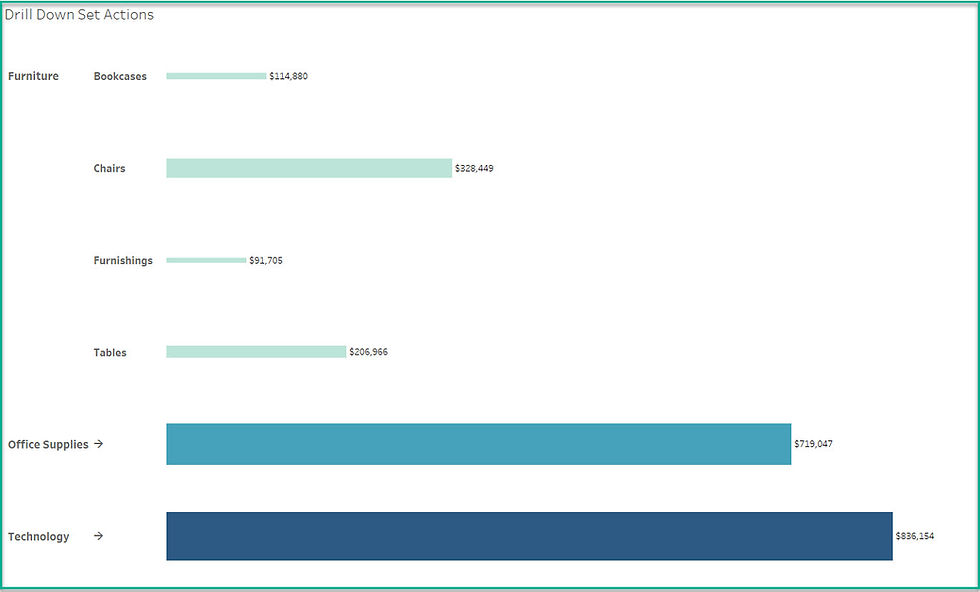
Here is an example:

In the second view below, you can click on the arrow to see the Proportional Bar Chart for each Sub-Category listed under Furniture. Notice how the width of Furnishings is smaller than Chairs.
Here are the steps to create this chart;
Create a Hierarchy by dragging Sub-Category under the Category in your Side Bar. You will be prompted for a custom name for this hierarchy, which I leave as the default.

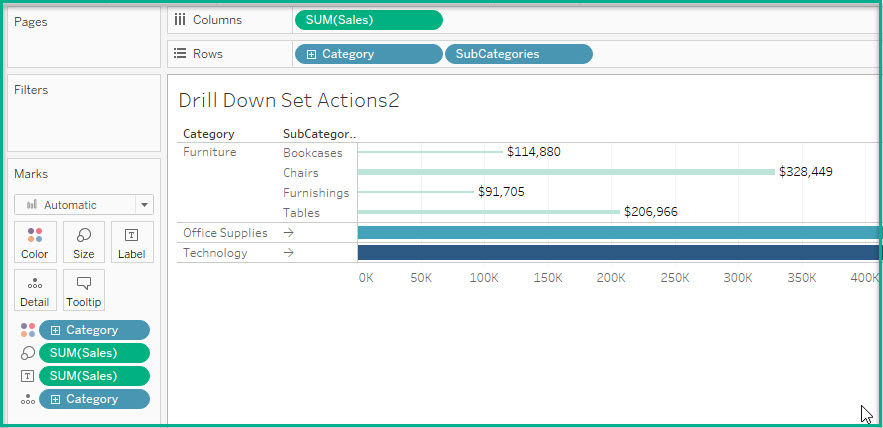
Place Sales on your Columns shelf.
Place Category on your Rows shelf.
Place Category on your Detail Marks card and on the Color Marks card.
Place Sales on the Label Marks card and format it as Currency without decimal places.
Right-click on Category and select Create > Set. Then on the Create Set pop-up menu, simply click OK. (You won't need to check anything.)
Then create the following Calculated Field;
Subcategories
IF [Category Set] then [Sub-Category]
Else '→ '
END
I grabbed the arrow from the Windows Character Map application. This is the formula you will need for your Set Action.
Place Subcategories on the Rows shelf next to the Category pill.
Go to the Worksheet menu and select Actions.
On the Actions pop-up menu select the Add Action > button. Select Change Set Values.

Select the Category set from the Set drop-down under the Set menu on the Add Set Action pop-up menu.
Rename the action to Update Category Set.
Select Run action on Select.
Under clearing the selection will: change the option to Remove all Values from set.

Then click OK.
You should now be able to drill down on the bar chart using this set action.

To make the Bars Proportional, drag the Sales value to Size.
The bars will change based on the size of the Sales values.
In my example I proceeded to remove all all the grid lines, etc to clean up the view.
The completed dashboard is located here for download in my Tableau Public profile.

Coba main di kabar4d, JP mulu!